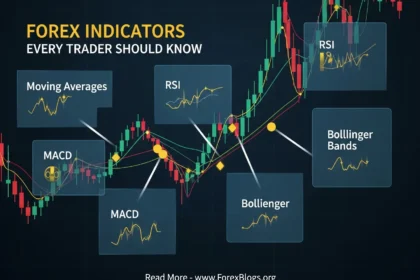
The first time I looked at a professional trader’s screen, I expected to see a chaotic web of neon lines, flashing oscillators, and complex mathematical formulas. I thought that’s what “real” trading looked like. Instead, I saw a clean, white chart with nothing but black and white bars. No RSI. No MACD. No moving averages. Just raw price. Forex Price Action Trading Without Indicators
It took me years to realize that the most successful traders aren’t the ones with the most sophisticated software. They’re the ones who have learned to read the footprints of the big players—the banks and institutions—without the filter of lagging indicators. This is the essence of price action trading. It’s about stripping away the noise to see the market for what it actually is: a continuous battle between buyers and sellers.
The Myth of the “Magic” Indicator – Forex Price Action Trading Without Indicators
Most retail traders start their journey by hunting for the “Holy Grail” indicator. They think if they can just find the right combination of settings, they’ll unlock a secret signal that predicts the future.
It doesn’t exist.
Every indicator you’ve ever used is a derivative of price. It’s a mathematical calculation based on what has already happened. If you’re waiting for a moving average crossover to enter a trade, you’re looking at a rearview mirror to decide where to steer the car. By the time the indicator gives you the “green light,” the smart money has often already entered, moved the market, and is looking for an exit.
Price action cuts out the middleman. When you trade the raw chart, you’re reacting to what is happening right now. You aren’t guessing based on a calculation; you’re observing the actual behavior of the participants.
More Read

The Foundation: Market Structure
Before you look for a single candle pattern, you have to understand the environment. Markets only do three things: they go up, they go down, or they go sideways.
I don’t care how many “buy” signals an oscillator gives you—if the market is making lower highs and lower lows, you shouldn’t be buying. That’s a downtrend. It’s gravity. In a healthy uptrend, price creates a staircase of higher highs and higher lows. This is market structure, and it’s the most important piece of information on your screen.
If the structure breaks—if a price fails to make a new high and instead crashes through a previous low—the story has changed. That’s your signal to stop looking for long positions and start pay attention to the shift in power.
Support and Resistance: Where the Action Happens
Think of support and resistance not as thin lines on a map, but as zones of high-interest. These are the “battlegrounds.”
Support is a floor where buyers have historically stepped in to stop the price from falling. Resistance is a ceiling where sellers have pushed back. Why do these levels work? Because humans have memories. If the Euro bounced off 1.0500 three times in the last month, every trader on the planet is watching that level.
But here’s the secret: indicators often fail at these levels. An RSI might say a pair is “oversold” right as it hits a support level, but price action tells you the real story. Does price pierce the level and then snap back? That’s a “fakeout,” and it’s one of the most profitable setups in a price action trader’s arsenal because it shows that the big players are trapping the retail crowd.
Reading the Candlesticks
Candlesticks are the language of the market. They don’t just show the price; they show the conviction of the move.
I don’t bother with the dozens of obscure Japanese candle names. You only need to understand a few key behaviors:
- The Rejection (Pin Bars): If you see a candle with a tiny body and a long tail poking through a support level, that’s a rejection. It means the bears tried to push the price down, but the bulls slapped them back with overwhelming force. It’s a sign of a potential reversal.
- The Engulfing Bar: This is pure momentum. It’s a large candle that completely “swallows” the previous candle. It tells you that one side has completely taken control of the narrative.
- The Indecision (Doji): Small bodies with wicks on both sides. This is the market catching its breath. It’s a “wait and see” signal.
When you combine these candles with a key level of support or resistance, you have a high-probability trade. A pin bar in the middle of a range is just noise. A pin bar hitting a multi-month resistance level? That’s an opportunity.
Why Simplicity Wins – Forex Price Action Trading Without Indicators
Trading without indicators is hard at first because it forces you to take responsibility. You can’t blame a “bad signal” from a computer program. You have to trust your eyes and your logic.
But it’s also incredibly liberating. When you stop looking at twenty different variables, your mind clears. You start to see the rhythm of the market. You see how price reacts when it gets near a big round number. You see the “stop hunts” where the price dips just low enough to kick out the weak hands before skyrocketing.
The professional doesn’t need a cluttered screen to see the truth. The truth is right there in the bars. Don’t overcomplicate it. Strip the junk off your charts, learn to read the structure, and wait for the market to show its hand. It’s not about being a math whiz; it’s about being a disciplined observer of human behavior.