
Price action definition
Price action is the study of price movements in a market with no indicators required. This strategy is among the most popular trading concepts and a trader who knows how to use it in the right way can often improve his or her performance and the way of looking at charts significantly. With price action traders can look to grade trends and market conditions, time entries and exits, and manage the risk of their trading operations. Price movement provides all the signals you will ever need to develop a high-profitability trading system. Price action helps you anticipate future price movements. Price action 3 Ways to Become a Better Trader
1. Support and resistance levels strategy
The process of finding support and resistance levels is an important skill in forex trading. Knowing the basics of support and resistance would improve upon any trading method.
When the market tests such levels, this could lead to a bounce in the opposite direction of the trend.
The level could be broken and the price could make a strong move in the direction of thebreakout.
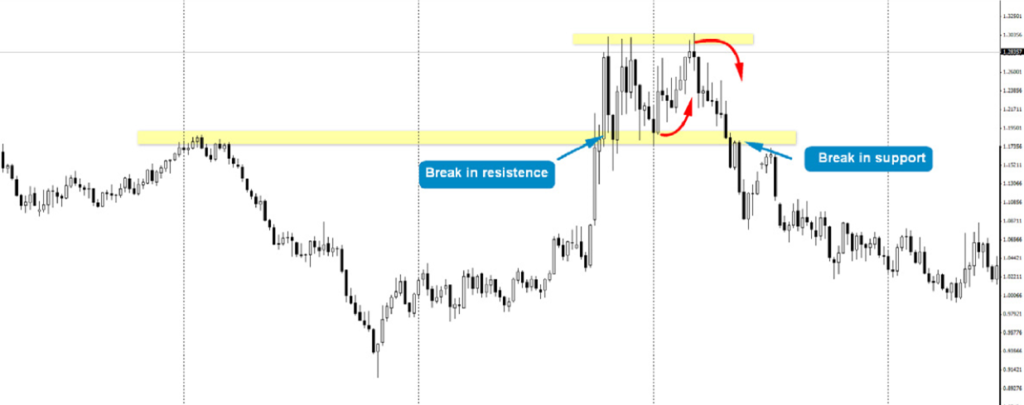
On the chart below you can see how resistance levels could turn into support levels. When price goes up through a resistance level and breaks it, this level becomes a new support zone and vice versa.
How to find support and resistance level?
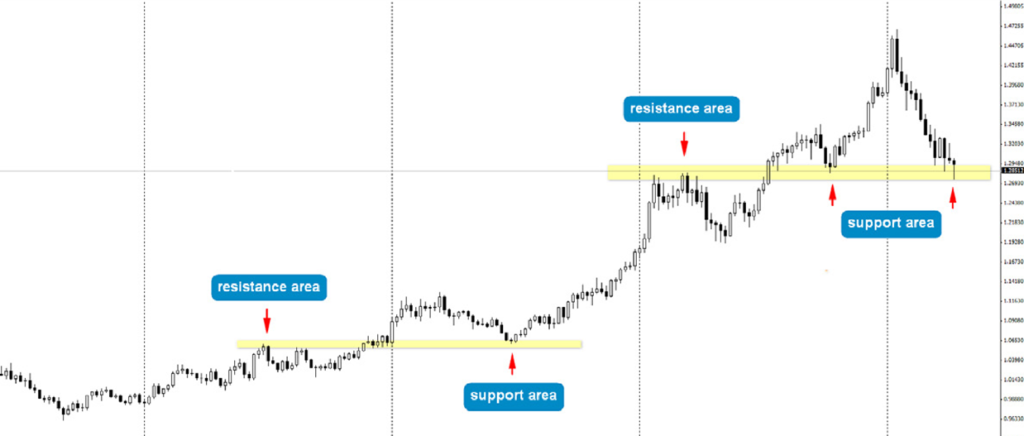
These levels are very easy to find on the trading chart. If we see the price dropping to a level and then going back up, we consider this area as an eventual point, wherethe market might find opposition the next time it gets there. If we see the price bouncing again from this level, then we confirm the level as a support. Then we assume that the market is likely to bounce off this support again in case of another drop. The same applies for resistance levels.
2. Pin Bar Trading Strategy
The pin bar trading strategy is one of the most popular strategies for beginners. It is a very obvious pattern, making it easy to identify on a chart. It is also one of the easier strategies to trade.
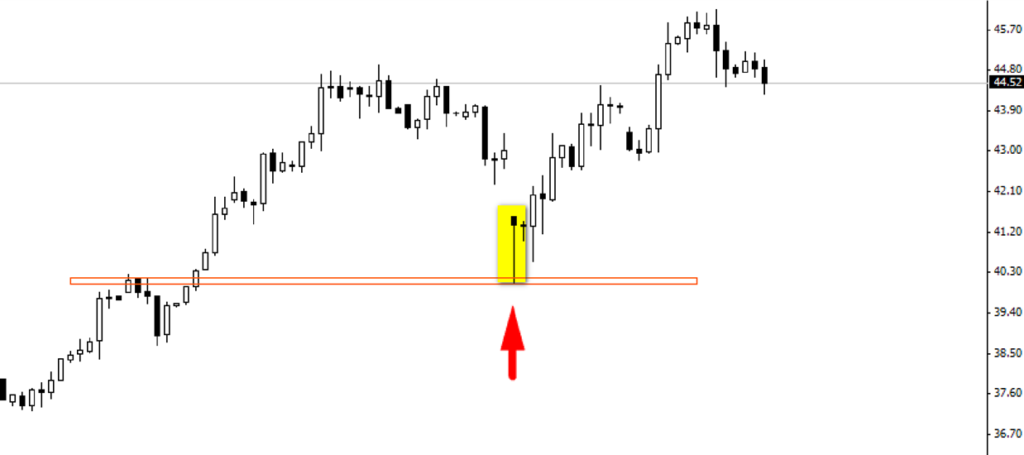
Notice how the market came into resistance during a rally but was soon able to break through that resistance. One of the basic principles of technical analysis is that former resistance becomes a bullish pin bar in the process.
The pin bar formation is a price action reversal pattern that shows that a certain level or price point in the market was rejected.
Let’s take a look at a bullish pin bar that formed on the Oil WTI 4-hour chart.
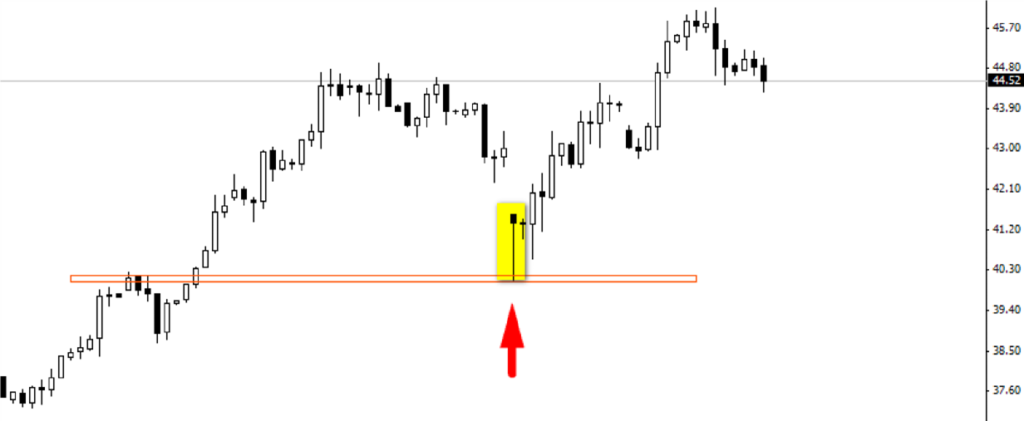
In the chart above, WTI tested a support price level which was a resistance level in the past.
What is a pin bar formation and how can you take advantage of the pin bar strategy in the context of varying market conditions?
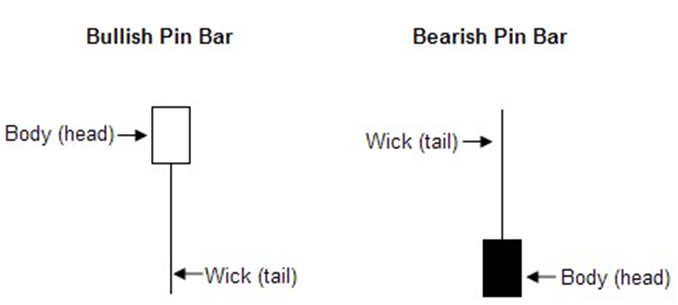
The pin bar should have a long upper or lower “wick” or “tail” and a smaller “body”. You should use candlestick charts because they show give you the clearest picture of price action. This kind of chart is used by professional traders. The candlestick version is generally regarded as a better visual representation of Price Action.
Few characteristics of Pin Bar:
- The tail of the pin bar shows the area of price that was rejected, and the implication is that price will continue to move opposite to the direction the tail points.
- The area between the opening and closing price is called the “body”. When the opening price is below the closing price the color of body is green or white. In the opposite situation, the color of candle is black or red (when using conventional platform settings).
- The opening price level and closing price level of the pin bar should be very close together or equal. The smaller the body the better.
- The tail of the pin bar sticks out from the surrounding price bars, the longer the tail of the pin bar the better.
- The tail of the pin bar should be two-thirds total pin bar height or more, and the rest of the pin bar should make up no more than a third of the pin bar.
Bullish Reversal Pin Bar Formation
In this formation the tail of the pin bar points downwards because it shows rejection of lower prices or a level of support.
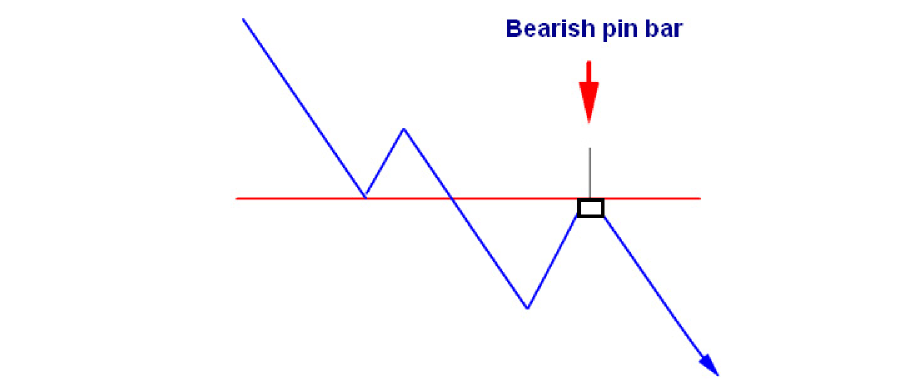
Bearish Reversal Pin Bar Formation
In this formation the tail of the pin bar points upwards because it shows rejection of higher prices or a level of resistance.
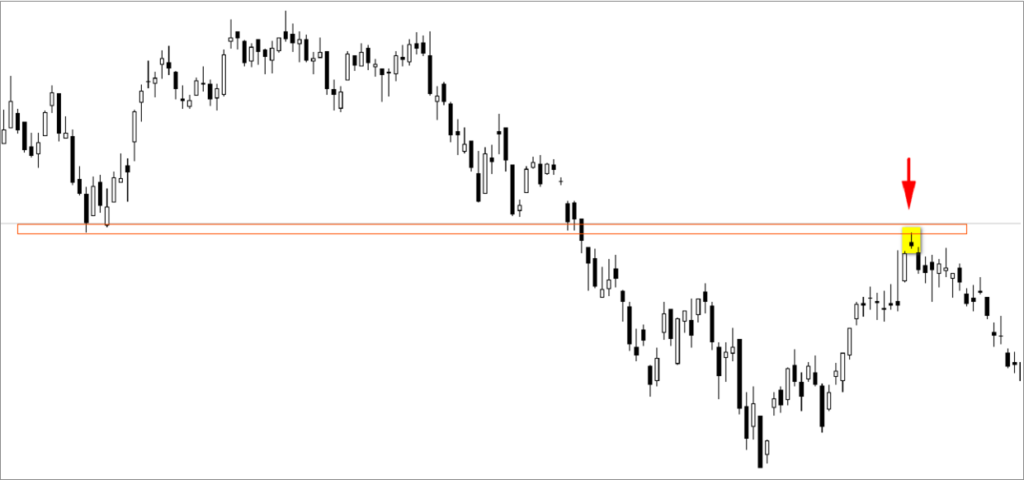
In the example above EURUSD price met resistance for a second time and after that the price went down, forming a pin bar reversal setup.
3. Inside bar Trading Strategy.
Inside bar – definition
Inside bar is a candle/bar (or series of bars) that is completely contained within the range of the preceding bar (mother bar). The inside bar should have a higher low and lower high than the preceding bar.
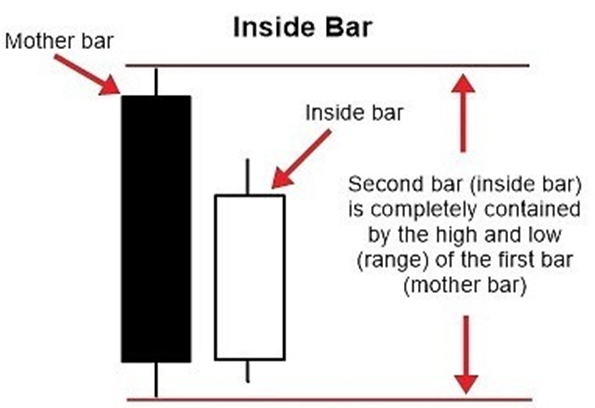
This strategy is a great trend continuation signal, but it can also be used as a turning point signal. An inside bar indicates a time of indecision or consolidation.
Continuation signals
We can use an inside bar as continuation signal. The best time to use it is when a strong trend is in progress or the market has clearly been moving in one direction and then decided to pause for a short time. The inside bar strategy should be used on the daily charts or sometimes on the 4 hour charts.
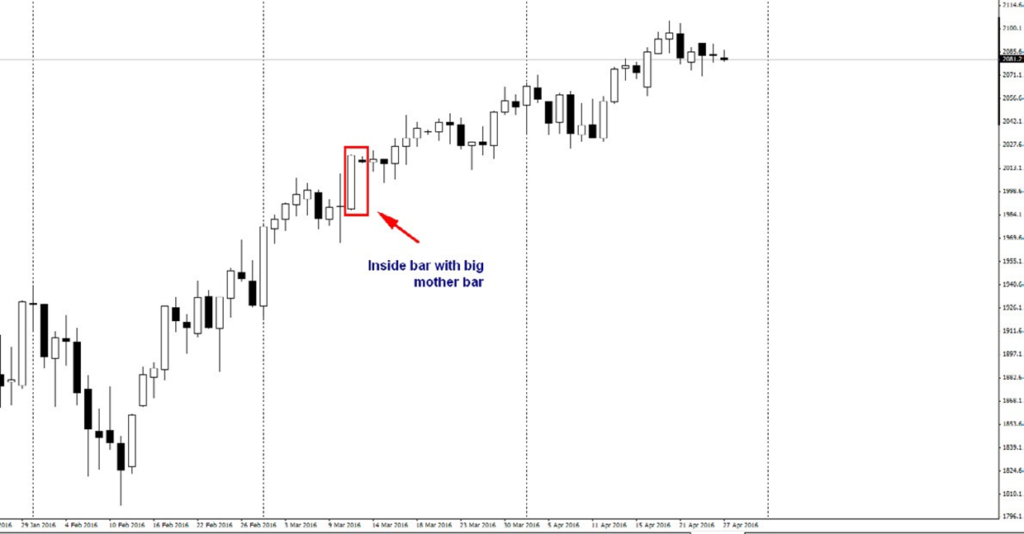
In the chart above you can see two examples of inside bar setups on the daily SP500 and WTI oil charts. On the first chart, you can see an inside bar with big mother bar in an uptrend, and on the second chart it is an inside bar setup in a downtrend.
Reversal signals
One of the most powerful ways to use PA trading strategies is a reversal signal. This strategy can provide accurate entries into a trending market or horizontal market. These signals can often provide good risk-to-reward potential.
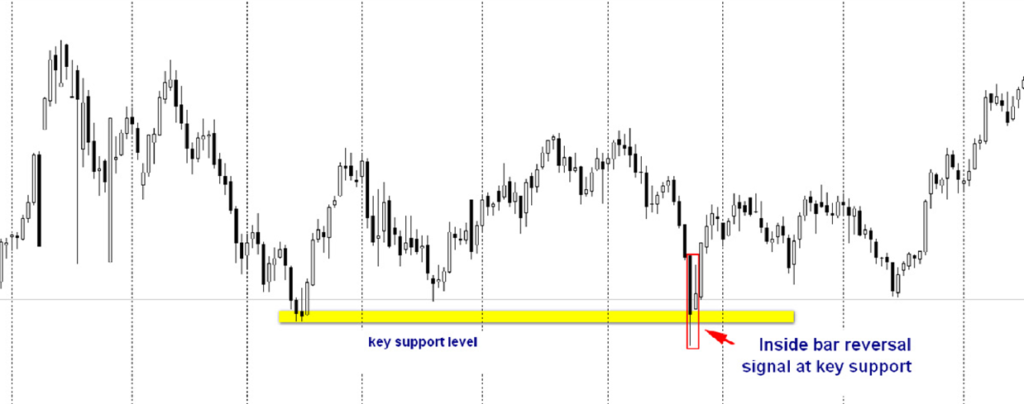
In the example above we can see a trade inside bar setup against the dominant daily chart trend. In this case, price had come back down to test a key support level and then formed an inside bar reversal. The next candle had great bullish momentum, which is the second strong signal to enter the market.
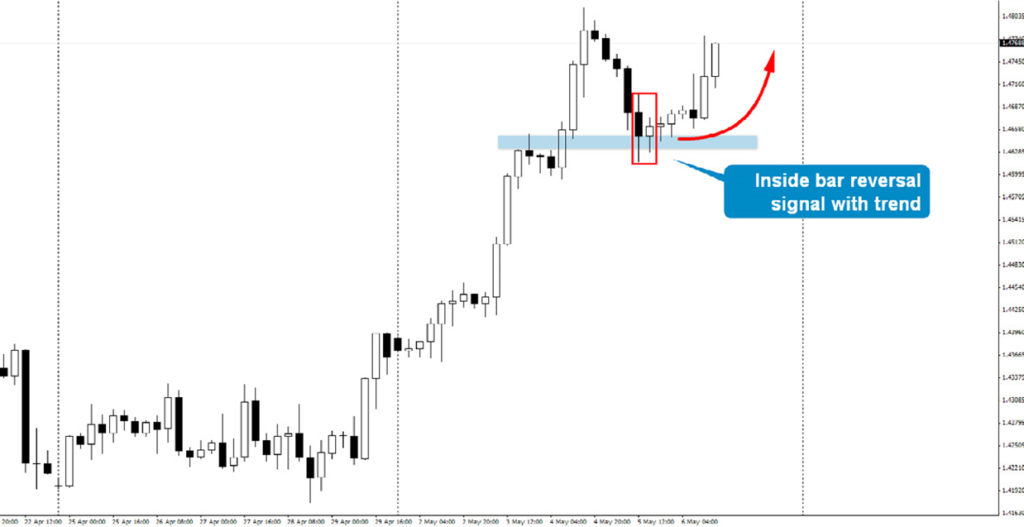
The chart above shows an example of using an inside bar signal as a reversal signal with the main 4 – hours trend in EURCAD.
Keep in mind:
- Price Action strategy is among the most popular trading concepts and a trader who knows how to use it in the right way can often improve his or her performance.
- Knowing the basics of support and resistance would improve upon any trading method.
- Pin bar trading strategy is one of the most popular strategies for beginners.- The inside bar strategy is a great trend continuation signal, but it can also be used as a turning point indicator.
☺ Happy Trading ☺
#PriceAction #TradingTips #DayTrading #StockMarket #ForexTrading #TechnicalAnalysis #PriceActionTrading #TraderEducation #FinancialMarkets #Investing #TradingStrategy #MarketAnalysis #ProfessionalTrading #ChartAnalysis #SwingTrading