Ever looked at a price chart and felt like you were staring at a heart monitor on caffeine? You aren’t alone. For a beginner, the constant up-and-down movement of currency pairs can feel like total chaos. But what if I told you there’s a hidden structure to that madness? That’s where understanding Support and Resistance in Forex Trading comes in. It’s probably the most important concept you’ll ever learn as a trader. Once you see it, you can’t unsee it.
- What exactly is Support and Resistance in Forex Trading?
- Why do Support and Resistance levels actually work?
- How to find Support and Resistance in Forex Trading like a pro
- 1. Zoom out on your charts
- 2. Look for the “obvious” turning points
- 3. Draw zones, not just thin lines
- 4. Connect the dots (but don’t force it)
- 5. Look for the “Role Reversal”
- Different types of Support and Resistance in Forex Trading
- How to actually trade these levels
- Common mistakes to avoid
- FAQs about Support and Resistance in Forex Trading
- Conclusion
What exactly is Support and Resistance in Forex Trading?
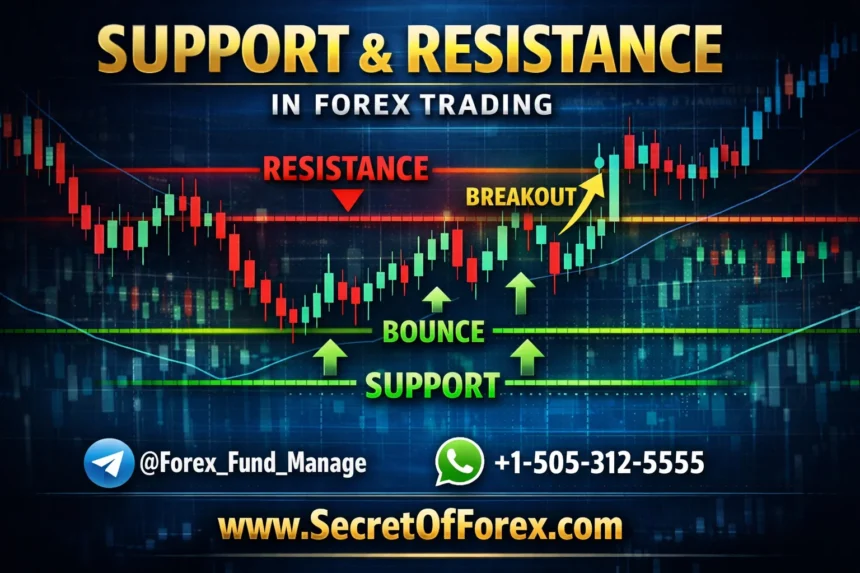
Think of price movement like a rubber ball bouncing around inside a house. When the ball hits the floor, it bounces back up. When it hits the ceiling, it drops back down. In the trading world, the floor is your “Support” and the ceiling is your “Resistance.”
Support is a price level where a downtrend tends to pause due to a concentration of demand. Basically, as the price gets lower, people see a bargain and start buying, which pushes the price back up.
Resistance is the exact opposite. It’s a price level where an uptrend pauses because there are more sellers than buyers. People think the price has peaked, so they sell to take their profits, which keeps the price from climbing higher.
For example, imagine the EUR/USD pair is falling. It hits 1.0500 and suddenly stops dropping, then heads back up. If it does this two or three times, 1.0500 is your support. It’s like the market is saying, “Nope, we aren’t going lower than this today.”
Why do Support and Resistance levels actually work?
It’s not magic; it’s mostly psychology. Most traders look at the same charts. When everyone sees the price hit a certain low point and bounce, they remember that. Next time the price gets close to that level, they think, “Hey, it bounced here last time, I should buy now!”
This creates a self-fulfilling prophecy. When thousands of traders (and big bank algorithms) all decide to buy at the same price, the price naturally goes up. Round numbers also play a huge role. You’ll notice that Support and Resistance in Forex Trading often happens at “big” numbers like 1.1000 or 1.2500 because humans love round numbers.
How to find Support and Resistance in Forex Trading like a pro
Finding these levels isn’t about being a math genius. It’s about being a good observer. Here is a simple, step-by-step guide to help you mark your charts without making them look like a bowl of spaghetti.
1. Zoom out on your charts
The biggest mistake beginners make is looking at a 5-minute chart and trying to find levels. It’s too noisy. Start with a Daily or 4-hour chart. Zoom out so you can see at least a few months of price action. The levels you find on these higher timeframes are much stronger and more reliable.
2. Look for the “obvious” turning points
Find the spots where the price clearly changed direction. You’re looking for “V” shapes (support) and “inverted V” shapes (resistance). If you see a spot where the price hit a level and went “Ouch!” and moved the other way fast, that’s a major level.
3. Draw zones, not just thin lines
This is a pro tip: support and resistance aren’t usually a single, exact price. They are more like “zones.” Price might go a few pips past your line before turning around. Instead of drawing a thin line, use a rectangle tool to mark a small area. This gives the market some “breathing room.”
4. Connect the dots (but don’t force it)
A level becomes stronger every time the price touches it and bounces. If you see three or four touches at the same level, you’ve found a very strong area of Support and Resistance in Forex Trading. However, don’t force lines where they don’t exist. If it’s not obvious, it probably isn’t a level.
5. Look for the “Role Reversal”
This is one of the coolest things in trading. Once a resistance level is broken, it often turns into a new support level. Imagine the price finally breaks through the “ceiling.” Now, that ceiling becomes the new “floor” it stands on. Traders call this a “Break and Retest,” and it’s a classic way to enter a trade.
More Read

Different types of Support and Resistance in Forex Trading
Not all levels look the same. While horizontal lines are the most common, there are other ways the market shows us where it wants to stop and turn.
Static Levels
These are the horizontal lines we just talked about. They stay at the same price regardless of time. These are the “heavy hitters” of the trading world.
Dynamic Levels
The market doesn’t always move sideways; sometimes it trends up or down. In this case, support and resistance move too. Many traders use Moving Averages (like the 50-period or 200-period EMA) as dynamic Support and Resistance in Forex Trading. If the price is trending up, it might keep bouncing off a moving average line like it’s a moving floor.
Trendlines
When the market is moving diagonally, you can draw a line connecting the lows (in an uptrend) or the highs (in a downtrend). These act as slanted support and resistance. If the price hits the trendline and bounces, the trend is still healthy.
How to actually trade these levels
Knowing where the levels are is one thing; making money from them is another. Most traders use two main strategies:
- The Bounce: You wait for the price to reach a support level and look for a reason to buy (like a bullish candlestick). You’re betting the “floor” will hold.
- The Break: You wait for the price to smash through a level. This usually happens with a lot of momentum. You’re betting that once the “wall” is broken, the price will keep running in that direction.
Just remember, don’t just set an order and walk away. Wait for the market to show you what it’s doing at that level. A little patience goes a long way.
Common mistakes to avoid
Even the best traders mess this up sometimes. Here are a few things to watch out for:
- Over-complicating your charts: If you have 20 lines on your screen, you’ll be too scared to take a trade. Keep it simple. Stick to the 3-5 most important levels.
- Trading “Naked” levels: Don’t just buy because the price hit support. Look for a “confirmation” like a pin bar or an engulfing candle. It’s like checking if the ice is thick enough before you walk on it.
- Ignoring the higher timeframe: If you’re trading on a 15-minute chart, but there is a massive daily resistance level right above you, your trade is probably going to fail. Always know what the “big picture” looks like.
- Thinking levels are permanent: Support and resistance aren’t brick walls; they are more like wooden fences. Eventually, they will break. Don’t get married to a level.
FAQs about Support and Resistance in Forex Trading
Which timeframe is best for finding support and resistance?
While you can find them on any timeframe, the Daily (D1) and 4-hour (H4) charts are the gold standard. Levels found here are much more respected by the market than levels found on a 1-minute chart.
How do I know if a level is about to break?
Usually, if the price keeps hitting a level over and over again in a short period, it’s getting weaker. Think of it like a hammer hitting a wall. Each hit creates a crack. Eventually, the wall gives way. Also, look for “higher lows” pushing into resistance—that’s a sign the buyers are getting aggressive.
Should I use indicators to find these levels?
You can, but you don’t have to. Tools like Pivot Points or Fibonacci Retracements can help, but nothing beats your own eyes. Learning to spot Support and Resistance in Forex Trading manually is a superpower that will serve you better in the long run.
Conclusion
At the end of the day, Support and Resistance in Forex Trading is all about finding where the “big money” is playing. It tells you where the battle lines are drawn between buyers and sellers.
Don’t worry if you don’t get it perfectly right the first time. It takes a bit of practice to develop an “eye” for it. Start by opening a demo account, zoom out on a few charts, and just start drawing boxes where the price seems to react. You’ll be surprised at how much clearer the market becomes once you see the framework behind it.
Ready to give it a try? Open up your trading platform today and see if you can spot the floors and ceilings on your favorite currency pair!
#ForexTrading #TechnicalAnalysis #SupportAndResistance #TradingStrategy #FXMarket #PriceAction #TradingEducation #ChartPatterns #DayTrading #SwingTrading #ForexAnalysis #MarketTrends #TradingTips #FinancialMarkets #InvestmentStrategy