Have you ever watched a stock hit the top of a Bollinger Band, assumed it was going to drop, and then watched in horror as it just kept climbing? Yeah, me too. It’s super frustrating when a trade goes the wrong way. Bollinger Bands are a fantastic tool for spotting price action and volatility, but using them all by themselves is a bit like driving with one eye closed. To really get a clear picture of what the market is doing, you need to know the best indicators to combine with Bollinger Bands. Let’s break down exactly how to pair them up so you can stop guessing and start making smarter trades.
- What Are Bollinger Bands (And Why Do They Need Friends)?
- Step-by-Step Guide: How to Trade with the Best Bollinger Band Combos
- Step 1: Pair with the RSI to Catch Reversals
- Step 2: Add the MACD to Confirm a Trend Breakout
- Step 3: Use Volume to Spot the “Fakeouts”
- Step 4: Combine Them and Set Your Rules
- Common Mistakes Beginners Make (And How to Avoid Them)
- 1. The “Band Touch” Trap
- 2. Cluttering Your Chart
- 3. Ignoring the Overall Trend
- 4. Forgetting the Squeeze
- 5. Not Waiting for the Candle to Close
- FAQs About Bollinger Band Strategies
- Conclusion
What Are Bollinger Bands (And Why Do They Need Friends)?
Before we start mixing and matching, let’s keep things simple. What exactly are we looking at when we put Bollinger Bands on a chart?
Think of Bollinger Bands like a slightly stretchy rubber band wrapped around the price of a stock or crypto. The indicator has three lines. The middle line is just a simple moving average (usually tracking the last 20 periods). The upper and lower bands act like boundaries. When the market gets crazy and volatile, the bands stretch wide. When the market is quiet and boring, the bands squeeze tightly together.
Here is a real-life way to look at it: Imagine a dog owner walking down the middle of a sidewalk. The owner is the middle line. The dog, running to the grass on the left or the street on the right, represents the price hitting the outer bands. Eventually, the leash pulls tight, and the dog has to come back toward the owner.
So, why not just trade the bands? Well, the bands only tell you where the price is relative to its recent history. They don’t tell you how strong a trend is or if a breakout is fake. That’s exactly why finding the best indicators to combine with Bollinger Bands is the secret to a winning trading strategy.
Step-by-Step Guide: How to Trade with the Best Bollinger Band Combos
You don’t need a messy chart with twenty different lines to be a good trader. You just need a few reliable tools that talk to each other. Here is a step-by-step guide on how to build a solid strategy using the best indicator combinations.
Step 1: Pair with the RSI to Catch Reversals
The Relative Strength Index (RSI) is hands down one of the best indicators to combine with Bollinger Bands. The RSI measures momentum on a scale of 0 to 100. If it goes over 70, the asset is considered “overbought” (too expensive). If it drops below 30, it’s “oversold” (too cheap).
How to use them together:
- Wait for the price to touch or poke outside the upper or lower Bollinger Band.
- Look down at your RSI.
- If the price hits the upper band and the RSI is over 70, that’s a strong signal the price might drop.
- If the price hits the lower band and the RSI is under 30, it’s a good sign the price might bounce up.
Quick Tip: Don’t jump in the second the price touches the band. Wait for the current candle to close to make sure it’s a real signal.
Step 2: Add the MACD to Confirm a Trend Breakout
If RSI is great for bouncing markets, the MACD (Moving Average Convergence Divergence) is your best friend for trending markets. The MACD helps you see the strength and direction of a trend.
More Read
How to use them together:
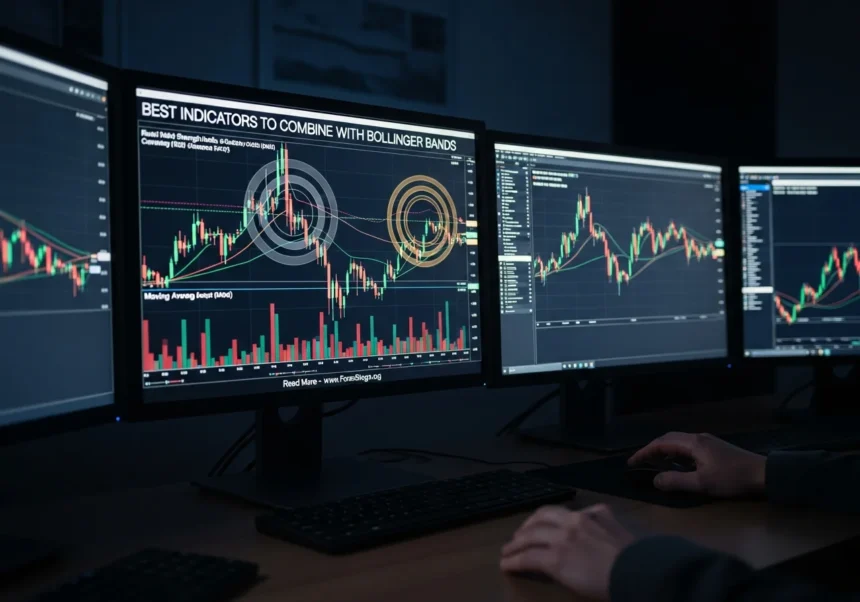
- Look for a “Bollinger Squeeze.” This is when the bands get super close together because the market is quiet.
- A tight squeeze means a big explosive move is coming, but the bands don’t tell you which way it will go.
- Check the MACD. If the MACD line crosses above the signal line during a squeeze, it’s a strong hint the price will break out to the upside.
- If the MACD crosses downward, get ready for the price to drop.
Step 3: Use Volume to Spot the “Fakeouts”
Volume isn’t a fancy line on a chart, but it is absolute magic when paired with Bollinger Bands. Volume tells you how many people are actually buying or selling.
How to use them together:
- Let’s say the price violently breaks through the upper Bollinger Band. It looks like a massive rally.
- Look at the volume bars at the bottom of your screen.
- If the volume is really low, it means big players aren’t supporting this move. It’s probably a trap (a fakeout), and the price will likely fall right back inside the bands.
- If the volume is huge, it confirms the breakout is real.
Step 4: Combine Them and Set Your Rules
Now that you know the tools, put it into a routine. A good beginner setup looks like this:
- Open your chart and apply Bollinger Bands (default 20, 2 settings).
- Add the RSI at the bottom of your screen.
- Look for the price to hit an outer band.
- Check the RSI to confirm if it is overbought or oversold.
- Enter the trade only if both indicators agree.
- Set your stop-loss just outside the band to protect your money if the trade goes south.
Common Mistakes Beginners Make (And How to Avoid Them)
Even when you know the best indicators to combine with Bollinger Bands, it’s easy to trip up. Here are a few common mistakes to watch out for.
1. The “Band Touch” Trap
This is the number one mistake new traders make. They see a green candle touch the top band, and they immediately hit the “sell” button. In a strong uptrend, the price can hug that top band and keep going up for days. A touch is not a signal to trade; it’s just a signal to pay attention.
2. Cluttering Your Chart
It’s tempting to throw Bollinger Bands, RSI, MACD, Stochastic, and five moving averages onto your screen. Don’t do it. You won’t be able to see the actual price candles. Pick one or two companion indicators and stick with them until you master how they move.
3. Ignoring the Overall Trend
If the stock market has been crashing for three weeks, buying a stock just because it touched the lower Bollinger Band is a bad idea. It’s like trying to stop a freight train with your bare hands. Always zoom out to a bigger timeframe (like the daily chart) to see the main trend before you place a trade.
4. Forgetting the Squeeze
A lot of people only focus on the wide, volatile parts of the bands. But the real money is usually made right after a tight squeeze. When the market is boring and the bands are flat, that is exactly when you should be paying the most attention.
5. Not Waiting for the Candle to Close
A candle might poke way outside the upper band while it’s forming, making you think a massive breakout is happening. But in the last ten seconds, it could drop back down and leave a long wick. Always wait for the candle to officially close before you make your move.
FAQs About Bollinger Band Strategies
Can I just use Bollinger Bands by themselves?
You can, but it’s pretty risky. Because the bands only measure past price and volatility, they don’t give you the full story. Using them alone often leads to buying or selling at the wrong time, which is why pairing them with an oscillator like the RSI is highly recommended.
What is the best timeframe for these indicator combos?
It honestly depends on your trading style. If you like day trading, the 15-minute or 1-hour charts work great. If you have a full-time job and prefer to check your charts less often, the 4-hour or daily charts are perfect. The indicator rules work exactly the same on any timeframe.
Which is better to use with Bollinger Bands: RSI or MACD?
Neither is strictly “better”—they just have different jobs. If the market is moving sideways in a channel, the RSI is your best bet for catching the bounces. If the market is in a strong trend or getting ready to break out of a squeeze, the MACD is the better choice.
Conclusion
Learning how to read the markets takes a little time, but it gets a whole lot easier when you stop relying on just one tool. Bollinger Bands are incredible for showing you the “boundaries” of the market, but they need a partner to show you the momentum.
By pairing the bands with the RSI to catch reversals, using the MACD for breakouts, and keeping an eye on volume, you’ll be way ahead of most beginners. You now know the best indicators to combine with Bollinger Bands to create a strategy that actually makes sense.
The best thing you can do right now is open up a free demo trading account. Throw these indicators on a chart and just watch how they move together for a few days. Don’t risk any real money until you feel comfortable spotting the setups. Happy trading!
#BollingerBands #TradingIndicators #TechnicalAnalysis #StockMarket #ForexTrading #CryptoTrading #DayTrading #SwingTrading #TradingStrategy #RSI #MACD #MarketAnalysis #FinancialEducation #InvestingTips #ChartPatterns