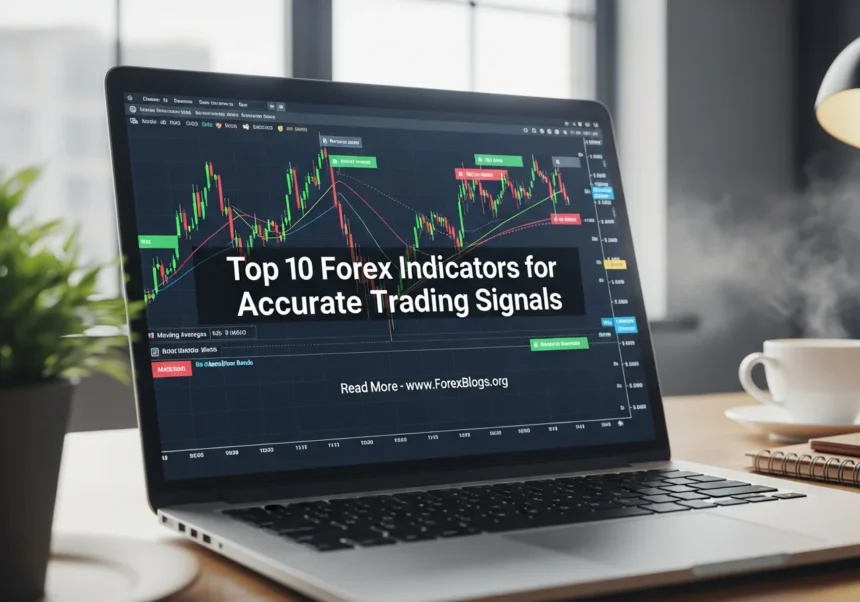
Ever stared at a trading chart and felt like you were trying to read an alien language? All those blinking numbers, red candles, and jagged lines can be super overwhelming when you’re just starting out. Top 10 Forex Indicators for Accurate Trading Signals
But don’t stress, because that’s exactly why learning the top 10 forex indicators is a massive game-changer. Think of them as your personal translators for the market, helping you spot the best times to buy, sell, or just wait it out.
Let’s break these tools down in plain English so you can finally make sense of your charts and start trading with some real confidence.
What Actually Are the Top 10 Forex Indicators?
If you strip away all the fancy wall-street jargon, forex indicators are just visual tools based on simple math. They take past price data—like where a currency pair opened, closed, or its highest point—and turn it into easy-to-read lines or charts on your screen.
Think of a forex indicator like a weather app on your phone. The app can’t guarantee it will rain with 100% certainty, but if it shows dark clouds and dropping barometric pressure, you know to grab an umbrella.
In trading, the market is the weather. Indicators simply give you a heads-up on what the market might do next, helping you make smarter, safer decisions instead of just guessing.
Step-by-Step Guide to Using the Top 10 Forex Indicators
Ready to set up your charts? Here is a practical breakdown of the best tools out there. You don’t need to use all of them at once, but testing them out step-by-step will help you find what fits your style.
1. Master the Trend with the Moving Average (MA) The Moving Average is the granddaddy of all indicators. It takes the average price of a currency pair over a set number of days and plots it as a single, smooth line on your chart.
This helps cut out the “noise” of random price spikes. If the price is above the moving average line, you’re generally in an uptrend (look to buy). If it’s below, you’re in a downtrend (look to sell).
Quick Tip: Most traders use the 50-day and 200-day moving averages. When the 50 crosses above the 200, it’s called a “Golden Cross” and is a popular buy signal!
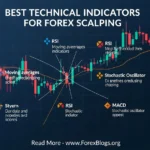
2. Check Momentum with the Relative Strength Index (RSI) The RSI is a little graph that sits at the bottom of your screen, moving between 0 and 100. It tells you if a market is running out of steam.
Think of it like a runner sprinting down the street. Eventually, they have to stop and catch their breath. If the RSI goes above 70, the market is “overbought” and might drop soon. If it dips below 30, it’s “oversold” and might be ready to bounce up.
3. Spot New Moves Using the MACD MACD stands for Moving Average Convergence Divergence. It sounds terrifying, I know, but it’s actually incredibly easy to read. It consists of two lines and a tiny bar chart (called a histogram).
You use the MACD to spot shifts in momentum. When the two lines cross over each other, it usually signals a new trend is forming. If the lines cross while heading upward, it’s a solid hint that buyers are taking control.
4. Measure Volatility with Bollinger Bands Bollinger Bands look like a tunnel that wraps around the price candles on your chart. They expand when the market is wild and squeeze together when the market gets quiet.
When the bands squeeze tightly together, it usually means a big breakout is coming soon. Also, if the price touches the top band, it often bounces back down to the middle, making it a great tool for spotting quick reversals.
More Read

5. Find Quick Reversals with the Stochastic Oscillator This one is very similar to the RSI, but it moves a bit faster. It also sits at the bottom of your chart and helps you find overbought and oversold conditions.
The Stochastic has two lines. The best way to use it is to wait for the lines to drop below the 20 level (oversold), and then buy when the lines cross each other and point back up. It works wonderfully in sideways, boring markets.
6. Set Better Stop-Losses with Average True Range (ATR) The ATR won’t tell you whether to buy or sell. Instead, it tells you exactly how wild and crazy the market is moving right now.
Beginners often get kicked out of good trades because they set their stop-loss too tight. By checking the ATR, you can see the average daily movement of a currency pair. This helps you place your stop-loss far enough away to avoid random market spikes.
7. Catch Bounces with Fibonacci Retracement Markets almost never move in a straight line. They push up, pull back a little bit, and then push up again. Fibonacci helps you guess where that pullback will stop.
When you draw this tool on your chart, it creates horizontal “floor” levels (like 50% or 61.8%). These are natural psychological areas where big banks and traders love to step back in and buy the dip.
8. Get the Big Picture with the Ichimoku Cloud I’ll be honest, the first time you put the Ichimoku Cloud on your chart, it looks like a toddler scribbled all over your screen. But it is surprisingly simple once you get the hang of it.
The main feature is the “cloud” itself. If the current price is floating above the cloud, you only look for buying opportunities. If the price drops below the cloud, you only look to sell. It’s an amazing all-in-one snapshot of the market.
9. Ride the Trend with Parabolic SAR This indicator prints little dots above or below the price candles on your chart. “SAR” stands for Stop and Reverse.
When the dots are below the candles, it means the trend is up. When the dots flip to the top, the trend is heading down. It’s an incredibly useful tool for figuring out exactly where to move your trailing stop-loss as your trade becomes profitable.
10. Confirm the Move with Volume In the stock market, volume tells you exactly how many shares were traded. In forex, we use “tick volume,” which measures how much activity is happening at a given moment.
If the price suddenly breaks out of a level, but the volume indicator is totally flat, it might be a fake move. But if the price breaks out and the volume spikes, you know the big players are involved and the move is likely real.
5 Huge Mistakes Beginners Make With Indicators
Learning the tools is only half the battle. Knowing what not to do will save you a ton of money and frustration. Here are a few common traps to avoid:
- The “Spaghetti Chart” Syndrome: This happens when you slap 8 different indicators on your screen at once. Your chart gets so cluttered you can’t even see the price anymore. Pick two or three that complement each other and stick to them.
- Ignoring Actual Price Action: Indicators are just math formulas based on old data. They lag behind real time. Always look at the raw price candles first—price is king, and indicators are just the advisors.
- Chasing the “Holy Grail”: A lot of beginners jump from the RSI, to the MACD, to the Stochastic, hoping to find a magical indicator that never loses. Spoiler alert: it doesn’t exist. Losses are just a normal part of doing business.
- Trading the News Blindly: When major economic news drops (like inflation reports), the market goes crazy. Indicators can’t predict news events, so they will often give you terrible signals during these wild spikes.
- Skipping the Demo Account: Please, don’t risk real money testing out an indicator for the first time. Open a free demo account, play around with fake money, and see how the indicator reacts to the market first.
Frequently Asked Questions
Do I need to use all the top 10 forex indicators at once?
Definitely not! Using all of them will just confuse you because they will give you conflicting signals. A good rule of thumb is to pick one for trend direction (like a Moving Average) and one for momentum (like the RSI).
Which indicator is the absolute best for beginners?
The Moving Average is usually the best starting point. It is incredibly visual, easy to understand, and does a great job of keeping you on the right side of the overall trend.
Are trading indicators just a scam?
Not at all. They are legitimate mathematical tools used by professionals worldwide. However, the scam is when someone on the internet tries to sell you a “secret” indicator that promises a 100% win rate. Always remember that indicators deal in probabilities, not certainties.
Ready to Chart Your Course?
Jumping into the currency markets can feel a bit intimidating at first, but it really doesn’t have to be a guessing game.
By taking the time to understand the top 10 forex indicators, you are giving yourself a massive advantage. You’re no longer just staring at random squiggly lines; you’re actually reading the story the market is trying to tell you.
The best thing you can do right now is open up a free demo trading account. Slap a Moving Average and an RSI on your chart, and just watch how the price reacts to them. Have fun playing around with the settings, and take it one step at a time. Happy trading!
#ForexTrading #TechnicalAnalysis #Top10ForexIndicators #TradingSignals #DayTrading #FXMarket #TradingStrategy #FinancialMarkets #ForexEducation #MetaTrader #InvestmentStrategy #ChartPatterns #TradingTips #ForexSignals #MarketAnalysis