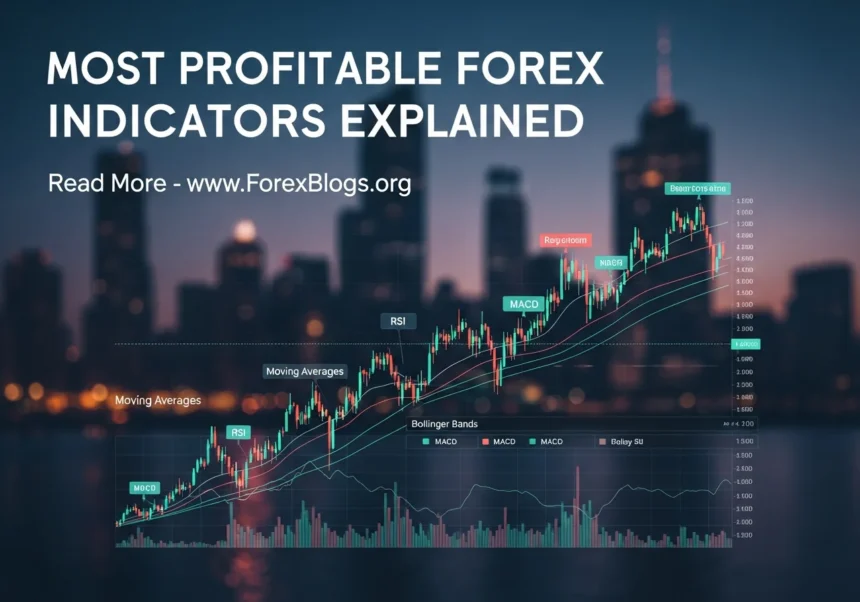
Ever stared at a forex chart and felt like you were trying to read an alien language? You’re definitely not alone. When you’re just starting out, the sheer number of lines, bars, and squiggles on the screen is enough to make anyone’s head spin. But here’s the good news: you don’t need to master a hundred different tools to make money. Finding the most profitable forex strategy is usually about keeping things simple and knowing which indicators actually work. Let’s break down the best ones so you can start trading with a lot more confidence. Most Profitable Forex Indicators Explained
What Are These “Most Profitable Forex” Indicators Anyway?
Think of forex indicators like the dashboard on your car. Your speedometer tells you how fast you’re going, and the fuel gauge tells you when you’re about to run out of gas.
Forex indicators do the exact same thing, but for currency prices. Instead of tracking speed or fuel, they look at past price data—like how high or low a currency pair went over a certain time—and use a bit of math to guess what might happen next.
Are buyers exhausted? Is a massive new trend starting? That’s what these tools help you figure out.
For example, imagine you are looking to buy a house. You wouldn’t just guess what a fair price is, right? You’d look at what similar houses in the neighborhood sold for over the last six months. Indicators do that math for you instantly on your screen. So, if you’re chasing the most profitable forex trades, these little visual helpers are your absolute best friends.
Before we jump into the steps, let’s look at the “Big Three” indicators that actually move the needle for beginners.
1. Moving Averages (The Trend Finder) If you only ever use one indicator, make it a moving average. All it does is smooth out the wild, jerky price movements on your chart into one clean, flowing line. If the line is pointing up, the trend is up. If it’s pointing down, the trend is down. It really is that simple.
2. Relative Strength Index or RSI (The Bargain Hunter) The RSI is a little line that sits at the bottom of your screen and bounces between 0 and 100. It tells you when a currency is “overbought” (too expensive) or “oversold” (on sale). Think of it like buying a TV. If the RSI is over 70, the TV is overpriced—don’t buy it. If it drops below 30, it’s Black Friday, and you might want to grab it.
3. MACD (The Momentum Catcher) MACD stands for Moving Average Convergence Divergence. Don’t let the clunky name scare you. It’s just a tool that helps you see if a trend is running out of steam or if it’s picking up speed. When the lines on the MACD cross over each other, it’s often a heads-up that the market is about to change direction.
More Read

How to Build the Most Profitable Forex Strategy (Step-by-Step)
Now that you know what the tools are, how do you actually use them without getting overwhelmed? Here is a simple, step-by-step guide to setting up your charts like a pro.
Step 1: Pick a clean charting platform Before you add anything, you need a good workspace. Free platforms like TradingView or MetaTrader 4 are perfect. Open up a chart for a major currency pair, like the EUR/USD. Make sure you are looking at candlestick charts, as they are the easiest to read.
Step 2: Start with the bigger picture Don’t jump straight into the 5-minute charts. That’s where the market is chaotic and unpredictable. Switch your chart to the 4-hour or Daily timeframe. This gives you a much clearer view of what the market is actually doing.
Step 3: Slap on a Moving Average Go to your indicators tab and add a “Simple Moving Average” (SMA). Set the length to 50. This means the line will show you the average price over the last 50 candles. Tip: If the current price is sitting above that 50 SMA line, you should only be looking for opportunities to buy. If it’s below the line, only look for chances to sell.
Step 4: Add the RSI for timing Now, add the Relative Strength Index to your chart. Leave it on the default setting (usually 14). You are going to use this to time your entry. You don’t want to buy when the trend is up but the price is already too high.
Step 5: Wait for the stars to align This is the hardest part for most beginners: waiting. Let’s say your 50 SMA is pointing up (meaning you want to buy). You wait patiently until the RSI dips down near the 30 mark (meaning the price is temporarily on sale). When both of these things happen at the same time, you have a high-probability setup.
Step 6: Plan your exit before you enter Never place a trade without knowing where you will get out if you are wrong. Place your “Stop Loss” just below the recent low. This protects your account from blowing up if the market suddenly turns against you.
5 Huge Mistakes Beginners Make with Indicators
Even with the best tools, it is incredibly easy to trip up. Here are a few common traps you’ll want to avoid.
- Mistake 1: Turning your chart into a spaghetti monster It’s tempting to add 10 different indicators to your screen to feel “safe.” Don’t do it. You won’t even be able to see the price anymore. This leads to analysis paralysis, where one indicator tells you to buy and another tells you to sell. Stick to two or three, max.
- Mistake 2: Thinking indicators predict the exact future Indicators are not magic crystal balls. They are based on past data. They can tell you what is likely to happen, but they can’t guarantee it. Always trade with the mindset that any single trade could be a loser.
- Mistake 3: Chasing the “Holy Grail” setting A lot of newbies waste months tweaking the settings on their RSI from 14 to 13 to 12, hoping to find a secret combination that never loses. It doesn’t exist. The standard settings work just fine for the vast majority of profitable traders.
- Mistake 4: Ignoring the actual price action Indicators are great, but the actual price candles are king. If your indicator says “buy” but you see a massive, scary red candle dropping like a rock, trust your eyes. Don’t blindly follow a squiggly line into a bad trade.
- Mistake 5: Forgetting about risk management You could have the greatest indicator strategy on earth, but if you risk 50% of your account on one trade, you will eventually lose all your money. Never risk more than 1% or 2% of your total account balance on a single setup.
Frequently Asked Questions
Can I rely on just one indicator to trade?
Honestly, no. It’s usually best to pair two together. Use one (like a Moving Average) to show you the overall trend, and another (like the RSI) to show you exactly when to enter. Just don’t overdo it. Two is a team; five is a crowd.
Which timeframe is best for these indicators?
If you’re a beginner, stick to the 1-hour or 4-hour charts. They have way less “fake” signals compared to the 1-minute or 5-minute charts. The slower timeframes give you time to think and plan without feeling rushed.
Are paid indicators better than free ones?
Nope! You’ll see tons of ads for expensive indicators promising huge returns. Ignore them. The most profitable forex traders in the world usually just use the free, standard tools that come with every basic charting platform. Save your hard-earned money for your actual trading account.
Conclusion
Forex trading doesn’t have to be a confusing mess of squiggly lines and flashing lights. By sticking to a few trusted indicators like Moving Averages and the RSI, and keeping your charts clean, you’re already miles ahead of most newbies.
Remember, the goal isn’t to predict the future perfectly every single time. That’s impossible. It’s simply about finding a small edge, managing your risk, and being patient enough to wait for the right setups.
Why not open up a free demo account today and plot a 50-period moving average on your favorite currency pair? Play around with it, watch how the price reacts to the line, and see how it feels. You might just find it’s a lot easier than you thought!
#forex #tradingindicators #forexstrategy #profitableforex #technicalanalysis #daytrading #currencytrading #forextips #investing #forextrader #tradingtools #marketanalysis #fxstrategies #pips #financialmarkets