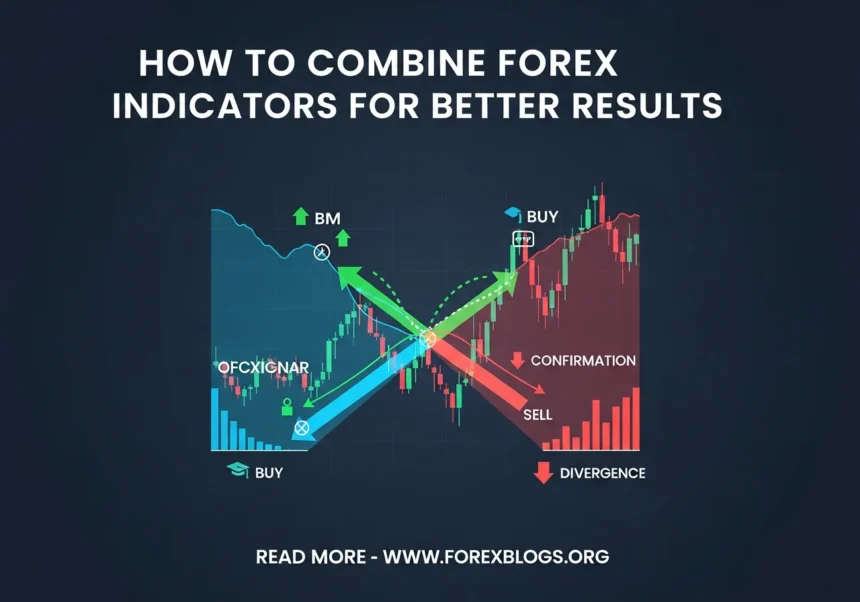
Ever opened a trading platform for the first time and felt completely overwhelmed? You look at the screen, and it looks like a toddler got hold of some neon markers and scribbled all over a math graph. We’ve all been there. How to Combine Forex Indicators for Better Results
When you first start trading, it is incredibly tempting to slap every single tool you can find onto your chart. You think that more tools will give you better signals, right? But here is the honest truth: using too many Forex indicators usually just leads to massive confusion and analysis paralysis.
You don’t need a messy, chaotic chart to make good trades. You just need a simple system that actually makes sense to you.
Let’s break down exactly how to combine these tools so they work together as a team, rather than fighting each other for your attention.
What Are Forex Indicators, Anyway?
Let’s keep this super simple. Think of Forex indicators like the dashboard lights in your car.
One gauge tells you how fast you’re going. Another warns you if your engine is getting too hot. A different light pops on when you’re running low on gas. You need all of these different pieces of information to drive safely.
In trading, indicators are just little math formulas based on past prices. They take all the messy data of the market and turn it into visual clues. These clues help you guess where the market might go next.
But here is the catch that a lot of beginners miss: no single indicator is perfect.
If you only look at your speedometer while driving, you might run out of gas. In trading, if you only look at one tool, you might miss a huge warning sign right in front of you. That’s why we combine them. We want different tools to confirm the same idea.
When multiple tools tell you the same thing, traders call this “confluence.” It is basically like checking your rearview mirror, your side mirror, and your blind spot before you change lanes.
Understanding the Four Main Indicator Families
Before we start mixing and matching, you need to know what’s in your toolbox. There are hundreds of Forex indicators out there, but almost all of them fall into one of four main categories.
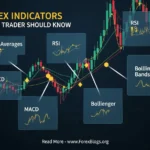
1. Trend Indicators These tell you which way the market is heading overall. Is it going up, down, or moving sideways? The most popular example here is the Moving Average. If the price is steadily staying above the Moving Average line, you are in an uptrend.
2. Momentum (Oscillator) Indicators These tell you how much energy is behind a move. Sure, the market is going up, but is it running out of breath? Tools like the Relative Strength Index (RSI) or the Stochastic Oscillator help you see if a trend is about to pause or reverse.
3. Volatility Indicators These measure how wild the market is acting. Are prices moving in tiny, quiet steps, or are they jumping around like crazy? Bollinger Bands and the Average True Range (ATR) are great for figuring out how explosive the market is right now.
4. Volume Indicators These show you how much buying and selling is actually happening behind the scenes. While volume is a bit tricky in the decentralized Forex market, tools like On-Balance Volume (OBV) can still give you a decent idea of market participation.
Step-by-Step Guide: How to Combine Forex Indicators
Now for the fun part. How do we put these together to find good trades? Follow these steps to build a simple, effective combination.
Step 1: Pick one tool from different families The golden rule of combining Forex indicators is to never pick two tools from the same family. If you put three trend indicators on your chart, they are all just telling you the same thing in slightly different ways.
Instead, pick one trend indicator and one momentum indicator. For example, let’s pair a 200-period Exponential Moving Average (EMA) with the RSI.
Step 2: Find the big picture first Always start by looking at your trend indicator. This is your foundation. Let’s say you are looking at the EUR/USD chart.
If the price is sitting above your 200 EMA, the overall trend is up. This means you should only be looking for opportunities to buy. Ignore any signals that tell you to sell. Trading with the trend is much easier than fighting it.
Step 3: Wait for a pullback using momentum Markets don’t just go straight up in a straight line. They move up, take a breather, and pull back down a bit before going higher. You want to buy during that breather.
This is where your momentum indicator comes in. Keep an eye on your RSI. You are waiting for the RSI to drop down to the “oversold” area (usually below 30). This tells you that the temporary pullback is running out of steam.
Step 4: Look for a price action trigger Indicators are great, but price is always king. Once your trend indicator says “buy” and your momentum indicator says “the pullback is over,” look at the actual candlesticks.
Do you see a nice, big bullish candlestick pushing up? Maybe a hammer pattern or an engulfing candle? That is your final green light to enter the trade.
Step 5: Set your safety nets Before you hit the buy button, you need to know where you’ll get out if you are wrong. You can use a volatility indicator like the ATR to help figure out where to place your stop loss.
If the market is moving wildly, the ATR will tell you to give your trade a little more breathing room so you don’t get stopped out by random noise.
More Read

Common Mistakes When Combining Forex Indicators
Even with a good step-by-step plan, it’s easy to fall into a few traps. Here are some of the biggest mistakes beginners make (and how to avoid them).
The “Spaghetti Chart” Mistake I see this all the time. A beginner trader will have five moving averages, MACD, RSI, and Bollinger bands all on one screen. You can’t even see the actual price bars anymore!
More indicators do not equal better trades. They just give you conflicting signals. Stick to two or three tools maximum. Keep your charts clean and easy to read.
Indicator Redundancy This happens when you use tools that do the exact same job. A classic mistake is putting both the RSI and the Stochastic on the same chart.
Because they are both momentum oscillators, they will almost always give you the exact same signal at the exact same time. It feels like you have double confirmation, but you really just have the same information twice. It gives you a false sense of confidence.
Ignoring Price Action Indicators are derived from price. That means price moves first, and the indicator moves second. They are naturally lagging.
If a massive news event happens and the price drops like a rock, your indicator might take a few minutes to catch up. Never blindly follow a squiggly line without looking at what the actual candlesticks are doing right now.
The “Holy Grail” Syndrome A lot of new traders jump from strategy to strategy. They try Moving Averages on Monday. They lose a trade, so they switch to Bollinger Bands on Tuesday.
They are looking for a magical combination of Forex indicators that wins 100% of the time. Let me save you some time: the magic combo doesn’t exist. Every strategy will have losing trades. Pick a logical combination, stick with it, and practice until you master it.
FAQs About Forex Indicators
How many indicators should I use at once?
Honestly, less is more. Aim for two to three indicators maximum. A great sweet spot is one trend indicator to show you the direction, and one momentum indicator to help you time your entry. Any more than three, and you’ll likely end up confused by conflicting signals.
What is the best combination of Forex indicators for beginners?
The most classic and reliable combination for beginners is a Moving Average paired with the RSI (Relative Strength Index). The Moving Average keeps you on the right side of the trend, while the RSI helps you spot good areas to jump in when the market pulls back. It’s simple, visual, and easy to learn.
Do indicators actually predict the market?
Nope. This is a tough pill to swallow, but no tool can predict the future. Indicators just show you what has already happened and help you spot recurring patterns. They give you probabilities, not guarantees. Your job as a trader is to manage your risk so that when the indicator is wrong (and it will be), you don’t lose your shirt.
Conclusion
Figuring out how to combine Forex indicators doesn’t have to feel like learning rocket science. It really just comes down to organizing your toolbox.
Remember the car dashboard analogy. You just need a few reliable gauges to tell you the direction, the speed, and the conditions of the road.
Start by cleaning up your charts today. Strip away all the noise until you just have bare price candles. Then, add one trend tool and one momentum tool. Watch how they interact with each other for a few days.
Don’t rush to risk your hard-earned money right away. Open up a free demo account and practice your new combination there. Try to spot the setups, take the trades, and see how it feels.
Trading is a journey, and finding the right tools that fit your personal style takes a little bit of time. Keep it simple, protect your capital, and don’t let the charts intimidate you!
#ForexIndicators #ForexTrading #TechnicalAnalysis #TradingStrategy #DayTrading #FXTrading #TradingTips #CurrencyTrading #MetaTrader #ForexSignals #Investing #MarketAnalysis #TradingEducation #ForexAnalysis #FinancialMarkets