Ever stared at a stock chart, watching a massive trend unfold, and thought, “Man, how did I miss that?” Yeah, we’ve all been there. Catching a solid trend right as it starts is the ultimate goal in trading, but timing it is rarely easy. MACD Crossover Strategy Explained
If you’ve been trading for a bit, you know that jumping in too early usually means getting stopped out. But waiting too long means you miss the meat of the move.
That’s exactly where a solid MACD crossover strategy comes in handy. It’s not a magic crystal ball, but it’s honestly one of the best ways to spot shifting momentum before price leaves you in the dust. Let’s break down how this works so you can actually start using it on your charts today.
What is the MACD Crossover Strategy?
To understand the strategy, we first need to quickly look at the tool itself. MACD stands for Moving Average Convergence Divergence. I know, it sounds like a mouthful of boring math.
But as an intermediate trader, you really only need to care about what it’s showing you visually. The MACD indicator is basically just a momentum gauge. It takes two moving averages of a price and measures the distance between them.
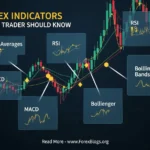
When you throw it on your chart, you’ll usually see three things:
- The MACD Line: This is the fast-moving line that reacts quickly to price changes.
- The Signal Line: This is the slower-moving line.
- The Histogram: Those little bars in the background that grow or shrink depending on how far apart the two lines are.
So, what is the MACD crossover strategy exactly?
It’s simply waiting for the fast MACD line to cross over the slow Signal line. Think of it like two cars on a highway. When the fast car overtakes the slow car, momentum is picking up in that direction. If the fast line crosses above the slow line, that’s a bullish signal. If it crosses below, it’s a bearish signal.
The Two Types of MACD Crossovers
Before we get into the step-by-step rules, we need to clear something up. Most people think there’s only one type of crossover. Actually, there are two distinct setups you should be watching.
1. The Signal Line Crossover This is the classic setup. It happens when the MACD line crosses the Signal line. This tells you that short-term momentum is shifting. It’s great for getting early entries into a new swing, but it can sometimes give you false signals if the market is just chopping around.
2. The Zero-Line Crossover If you look closely at your MACD indicator, you’ll notice a horizontal line right in the middle at the “0” level. When both the MACD and Signal lines cross above this zero line, it means the overall trend has officially shifted to bullish. When they drop below zero, the longer-term trend is officially bearish.
A lot of successful traders combine both. They wait for a signal line crossover for an early entry, and then use the zero-line crossover as confirmation to add to their position.
Step-by-Step Guide: Trading the MACD Crossover Strategy
Alright, let’s get into the fun stuff. How do you actually trade this without getting chopped to pieces? Here is a simple, repeatable framework you can use.
Step 1: Set Up Your Chart First, pull up your favorite charting platform and add the MACD indicator. The default settings are almost always 12, 26, 9. Honestly, just leave them there. Unless you have a very specific reason to tweak them, the default settings work incredibly well for most timeframes.
Step 2: Identify the Bigger Trend Do not skip this step. Trading every single MACD crossover you see is a guaranteed way to lose money. You need a filter. Tip: Throw a 200-period Simple Moving Average (SMA) on your chart. If the price is above the 200 SMA, only look for bullish crossovers. If the price is below it, only take bearish crossovers.
Step 3: Wait for the Trigger Let’s say you’re looking for a long trade because price is above the 200 SMA. You want to watch the MACD indicator and wait for the fast MACD line to cross above the slower Signal line. Ideally, you want this crossover to happen below the zero line. Why? Because it means the market had a short-term pullback, and momentum is just starting to turn back in the direction of the main trend.
Step 4: Confirm with Price Action The MACD is a lagging indicator. It tells you what just happened, not what’s going to happen. So, never trade a crossover blindly. Look at your candlestick chart. Did the price just bounce off a major support level? Did it form a bullish engulfing candle? If the MACD crosses and price action confirms it, you have a high-probability setup.
Step 5: Place Your Stop Loss and Take Profit Once you enter the trade, immediately protect your capital. A good rule of thumb is to place your stop loss just below the most recent swing low (for a long trade). For taking profit, you have a couple of options. You can aim for a fixed 1:2 risk-to-reward ratio, or you can simply ride the trend until the MACD crosses back over in the opposite direction.
Indicators to Pair with Your Crossover
Like I mentioned earlier, trading the MACD completely by itself isn’t always the best idea. It works so much better when you give it a buddy. Here are a couple of tools that pair beautifully with a MACD crossover strategy.
The RSI (Relative Strength Index) The RSI is fantastic for spotting overbought or oversold conditions. If the MACD gives you a bullish crossover right when the RSI is climbing out of the oversold territory (below 30), you’ve got a really strong signal on your hands.
Support and Resistance Zones This is basic price action, but it’s powerful. If you get a bearish MACD crossover right as the price hits a massive historical resistance level, the odds of the trade working out in your favor skyrocket. Context is everything.
More Read

5 Common Mistakes You’re Probably Making
Even with a solid plan, it’s super easy to mess this up. Here are a few traps I see intermediate traders fall into all the time.
1. Trading in a Choppy Market The MACD crossover strategy is a trend-following system. Period. If the market is moving sideways in a tight range, the moving averages will just tangle together. You’ll get a buy signal on Monday, a sell signal on Tuesday, and you’ll just bleed out from a thousand tiny cuts. If the chart looks flat, sit on your hands.
2. Ignoring the Histogram A lot of traders just stare at the two lines, but the histogram is actually your early warning system. Before a crossover even happens, you’ll usually see the histogram bars start to shrink. This tells you momentum is fading and a crossover might be coming soon. Use it to prep your trades.
3. Chasing Late Crossovers Sometimes you’ll open a chart and see that a crossover happened five candles ago, and the price has already shot up. Don’t chase it. If the lines are already super far apart, the move is likely exhausted. Wait for the next pullback.
4. Forgetting the Higher Timeframe If you’re trading on a 15-minute chart, always check the 1-hour or 4-hour chart first. If the 4-hour MACD is pointing straight down, taking a bullish crossover on the 15-minute chart is super risky. You’re basically swimming against the current.
5. Treating the MACD as Gospel It’s just an indicator, guys. It’s a mathematical formula based on past price. It doesn’t know that a major news event is about to drop, and it doesn’t know what institutional buyers are doing. Always manage your risk because false signals will happen.
FAQs About the MACD Crossover Strategy
What is the best timeframe for MACD crossovers?
It honestly depends on your trading style. Swing traders love the daily and 4-hour charts because the signals are much more reliable and filter out the daily noise. If you’re a day trader, the 15-minute and 5-minute charts work, but you’ll have to deal with more false signals.
Can I use the MACD for both stocks and crypto?
Absolutely. The MACD simply measures momentum based on price data. Whether you’re looking at Apple stock, Bitcoin, or the EUR/USD forex pair, price action and momentum work essentially the same way. The strategy translates perfectly across different markets.
Should I change the MACD settings for day trading?
Some day traders like to speed up the MACD to get faster signals, changing the settings to something like 5, 13, 1. But honestly, faster settings just mean more fake-outs. I highly recommend sticking to the default 12, 26, 9 and just dropping to a lower timeframe chart instead.
Conclusion
At the end of the day, the MACD crossover strategy is a classic for a reason. It’s visual, it’s relatively simple to grasp, and when combined with a broader trend, it can catch some seriously massive moves.
Just remember that no indicator works 100% of the time. The secret sauce isn’t the MACD itself—it’s how you use it alongside market context, price action, and strict risk management.
If you want to get comfortable with this, don’t just take my word for it. Open up your charting software, scroll back a few months on your favorite pair or stock, and see how the crossovers played out. Better yet, load up a demo account and take a few practice trades this week. You’ll get a feel for the rhythm of it in no time.
#MACD #MACDCrossover #TradingStrategy #TechnicalAnalysis #StockMarket #DayTrading #Investing #FinanceTips #TradingIndicators #SwingTrading #MarketAnalysis #ChartPatterns #FinancialEducation #Traders #StockTrading