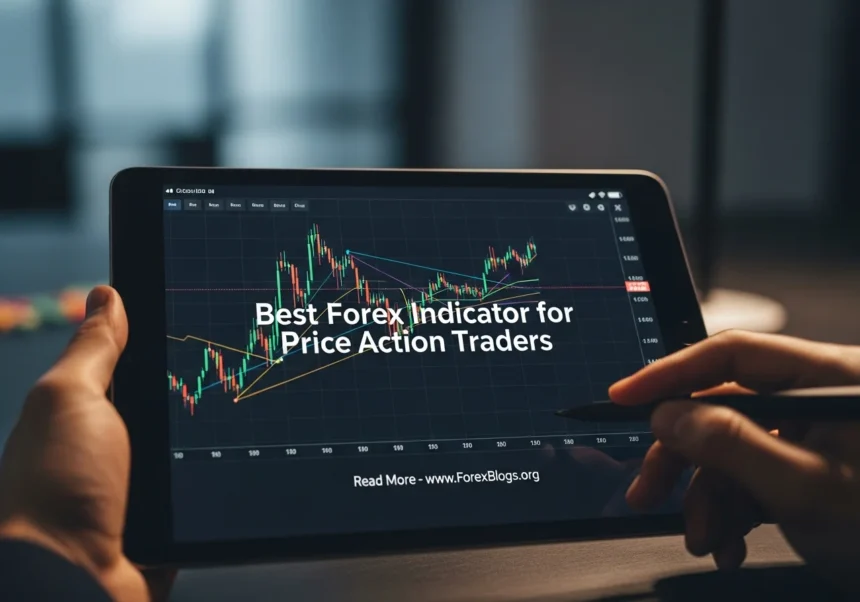
You’re definitely not alone. A lot of beginners hear that trading “naked charts” is the only way to go, but relying just on blank candlesticks can feel super overwhelming at first. Best Forex Indicator for Price Action Traders
- What is the Best Forex Indicator for Price Action Traders?
- Step-by-Step Guide: How to Use the Best Forex Indicator for Price Action Traders
- Step 1: Clean Up Your Chart
- Step 2: Spot the Overall Trend Direction
- Step 3: Wait for the Pullback to the “Value Area”
- Step 4: Look for a Price Action Trigger
- Step 5: Set Your Stop Loss and Let It Run
- 6 Common Mistakes When Combining Indicators with Price Action
- 1. Treating the Indicator Line Like a Brick Wall
- 2. Changing Settings After Every Losing Trade
- 3. Ignoring Basic Market Structure
- 4. Overcomplicating the Chart Again
- 5. Forgetting About the Overall Context
- 6. Trading in a Choppy Market
- FAQs About Indicators and Price Action
- Can I trade price action without any indicators at all?
- What timeframe is best for using moving averages with price action?
- Is RSI a good forex indicator for price action traders?
- Conclusion
Sometimes, you just need a little backup to confirm what your eyes are seeing.
If you are trying to figure out the best forex indicator for price action traders, you have landed in the right spot. Let’s break down the one tool that will actually help you catch better trades, all without turning your screen into a messy laser show.
What is the Best Forex Indicator for Price Action Traders?
Before we name the winner, let’s talk about what price action trading actually is.
At its core, price action means making trading decisions based entirely on raw price movements. You are looking at candlestick patterns, support and resistance levels, and the overall market structure.
Pure price action traders usually hate indicators. They think indicators are “lagging” and just tell you what already happened.
But let’s be real. When you are just starting out, reading raw price action is like trying to read a book in a foreign language. You need a translator.
So, what is the best forex indicator for price action traders?
It’s the Exponential Moving Average (EMA). Specifically, the 20-period or 50-period EMA.
Why the EMA?
The EMA is a line that sits right on your chart and tracks the average price of a currency pair over a set number of periods. Unlike other indicators that sit in a separate box at the bottom of your screen and distract you, the EMA hugs the price.
It doesn’t scream “buy” or “sell” at you. Instead, it quietly gives you context.
Here is a real-life way to think about it. Imagine you are driving a car on the highway.
The raw price action (the candlesticks) is your windshield. It shows you exactly what is right in front of you. You need to keep your eyes on it 90% of the time.
The EMA is your rearview mirror. You don’t stare at it the whole drive, but glancing at it helps you understand your surroundings so you can make a safe lane change.
EMA vs. SMA: Why the “Exponential” Part Matters
You might be wondering why we don’t just use a Simple Moving Average (SMA).
The SMA treats all past data equally. If you use a 20-day SMA, the price from 20 days ago has the exact same weight as the price from today.
The EMA is smarter. It gives more weight to the most recent price action.
Since price action traders care mostly about what the market is doing right now, the EMA reacts much faster to sudden market shifts. It gives you a cleaner, more accurate picture of the current trend.
Step-by-Step Guide: How to Use the Best Forex Indicator for Price Action Traders
Now that we know the EMA is our go-to tool, how do we actually use it?
You don’t want to just slap it on your chart and start buying every time the price touches the line. That is a quick way to blow your trading account.
Instead, you want to use it as a dynamic support and resistance zone.
Here is a simple, highly effective step-by-step strategy for combining the EMA with pure price action.
Step 1: Clean Up Your Chart
First things first, get rid of the clutter.
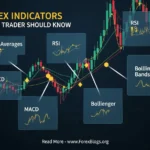
Remove the RSI, the MACD, the Bollinger Bands, and whatever else you have running. Your chart should just be clean candlesticks with a white or black background.
Once your chart is clean, add a single Exponential Moving Average. Set the length to 20.
Tip: If you are trading higher timeframes like the daily chart, a 50 EMA is also a fantastic choice. For this guide, we will stick to the 20 EMA.
Step 2: Spot the Overall Trend Direction
The very first thing the EMA does for you is answer a simple question: “Should I be buying or selling today?”
Look at where the current candlesticks are relative to the EMA line.
If the price is consistently moving above the 20 EMA, and the line is pointing upwards, you are in an uptrend. You should only be looking for buy setups.
If the price is moving below the EMA, and the line is pointing down, you are in a downtrend. You only want to look for sell setups.
If the price is just chopping back and forth through a flat EMA line, the market is ranging. Stay out. Don’t force a trade when the market is confused.
More Read
Step 3: Wait for the Pullback to the “Value Area”
This is where most beginners mess up. When they see an uptrend, they get excited and buy at the very top.
Then, the market naturally pulls back, stops them out, and continues higher without them. It is incredibly frustrating.
Instead of chasing the price, let the price come back to you.
In a healthy trend, the price will push away from the 20 EMA, and eventually pull back to touch it. Think of the EMA as a rubber band. Price can stretch away from it, but it always snaps back eventually.
When the price touches the EMA during a trend, it has entered the “Value Area.” This is where you want to start paying close attention.
Step 4: Look for a Price Action Trigger
This is the magic step. This is where the best forex indicator for price action traders actually meets price action.
Just because the price touches the EMA doesn’t mean you blindly enter a trade. You need a candlestick pattern to prove that the trend is ready to resume.
Wait for a specific price action trigger right at the EMA line.
What does a trigger look like?
- A Pin Bar: A candle with a long wick that rejects the EMA line.
- An Engulfing Candle: A large candle that completely swallows the previous smaller candle, pushing away from the EMA.
When you see one of these patterns form right on the moving average, the market is giving you a massive clue. It is saying, “Hey, we pulled back, found support at the moving average, and now buyers are stepping back in.”
Step 5: Set Your Stop Loss and Let It Run
Once you enter the trade based on your candlestick trigger, you need to protect your capital.
Place your stop loss just on the other side of the EMA and the candlestick wick. If the price breaks heavily through the moving average and takes out your stop, the trend is likely over anyway.
For your target, look at the next major support or resistance level on your chart.
By using the EMA to find the value area, and pure price action to enter the trade, you keep your risk incredibly small while aiming for a much larger reward.
6 Common Mistakes When Combining Indicators with Price Action
Even with the best tools, forex trading is tough. Beginners often fall into a few predictable traps when trying to merge indicators with naked charting.
Here are the biggest mistakes to avoid so you don’t sabotage your own success.
1. Treating the Indicator Line Like a Brick Wall
A moving average is a zone, not a concrete wall.
Beginners often freak out if a candlestick wick pokes slightly through the EMA line. They assume the trend is broken and exit their trade too early.
Price action is messy. Sometimes the price will dip a few pips below your indicator before rocketing back up. Give the market a little room to breathe. Focus on how the candle closes, not just how far the wick stretches.
2. Changing Settings After Every Losing Trade
We have all been there. You take two trades using the 20 EMA, and both hit your stop loss.
Frustrated, you go into the settings and change it to a 34 EMA. Then a 50 EMA. Then a 200 EMA.
Stop doing this. The secret to trading isn’t finding a magic number that never loses. Losses are just a normal business expense in forex. Pick one moving average setting, stick with it for at least 100 trades, and learn how price reacts to it.
3. Ignoring Basic Market Structure
The EMA is a great helper, but it does not override basic market structure.
If the price is pulling back to your EMA, but it’s doing so right into a massive, multi-year resistance level you drew on the weekly chart, you probably shouldn’t buy.
Always zoom out. Look at the big picture. Your indicator should confirm the market structure, not fight against it.
4. Overcomplicating the Chart Again
It happens slowly. First, you just have your price action and your moving average.
Then you read an article about the Stochastic oscillator, so you add that. Then a friend tells you about Fibonacci retracements, so you draw those all over the screen.
Suddenly, your chart looks like a tangled bowl of spaghetti again.
Remember why you chose to be a price action trader in the first place. Keep it simple. The more variables you add to your chart, the more you will second-guess your trading decisions.
5. Forgetting About the Overall Context
Indicators are just math formulas based on past price. They don’t watch the news.
If a major economic event is happening—like Non-Farm Payrolls (NFP) or an interest rate decision—your moving average means absolutely nothing.
During high-impact news, price action goes crazy. Spikes will rip right through your moving averages and hit your stop loss before you can blink. Always check a forex economic calendar before you sit down to trade.
6. Trading in a Choppy Market
As we mentioned earlier, moving averages are useless when the market is moving sideways.
If you look at your chart and the EMA is totally flat, and the candlesticks are just weaving up and down through the line like a snake, do not trade.
Price action trend-following strategies only work when there is an actual trend. If the market is asleep, keep your money in your pocket and go do something else.
FAQs About Indicators and Price Action
Can I trade price action without any indicators at all?
Absolutely. Many professional traders use completely blank charts. They rely entirely on drawing their own support, resistance, and trendlines. However, for beginners, using a single tool like the 20 EMA can drastically speed up the learning curve by helping you visualize the trend direction much faster.
What timeframe is best for using moving averages with price action?
The beauty of price action is that it works on every single timeframe. Whether you are scalping on the 5-minute chart or swing trading on the daily chart, the concepts remain exactly the same. That said, beginners usually do much better starting on the 1-hour or 4-hour charts. The price moves a bit slower, giving you more time to spot your candlestick setups.
Is RSI a good forex indicator for price action traders?
The Relative Strength Index (RSI) is popular, but it can be tricky for price action traders. It often tells you a market is “overbought” during a really strong uptrend, tricking you into selling when you shouldn’t. If you want to keep your focus on the actual candles, an overlay indicator like the EMA is usually a much better fit than a separate oscillator like the RSI.
Conclusion
Learning to read the market takes time, patience, and a lot of practice. You don’t need a million squiggly lines on your screen to be profitable.
By keeping things simple, you give yourself a massive advantage.
When you pair pure candlestick analysis with the 20 or 50 Exponential Moving Average, you truly have the best forex indicator for price action traders at your fingertips. It gives you the perfect blend of raw market psychology and clear trend direction.
Next time you open your charting software, try clearing out all the junk. Add a single EMA, look for those pullbacks, and wait for the market to give you a clear sign.
If you found this guide helpful, pull up a demo account today and try spotting just three solid price action setups using the EMA. Happy trading!
#ForexTrading #PriceAction #ForexIndicators #DayTrading #TechnicalAnalysis #TradingStrategy #CurrencyTrading #PriceActionTrader #ForexMarket #TradingSignals #FinancialMarkets #MT4Indicators #TradingEducation #SmartMoneyConcepts #FXTrading